
Lawrence Berkeley National Laboratory
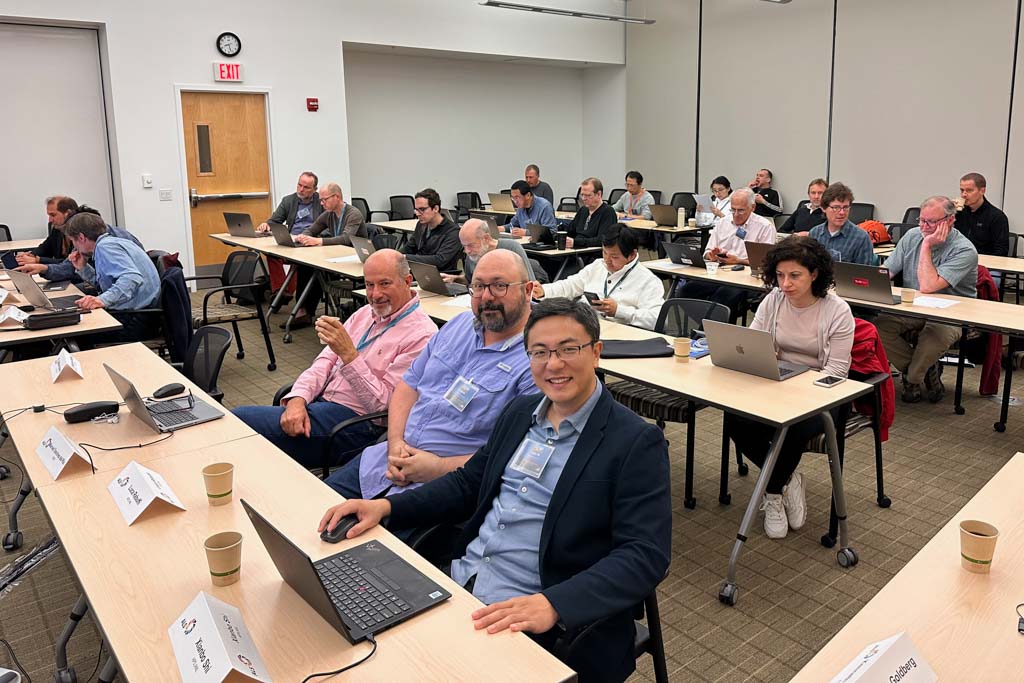
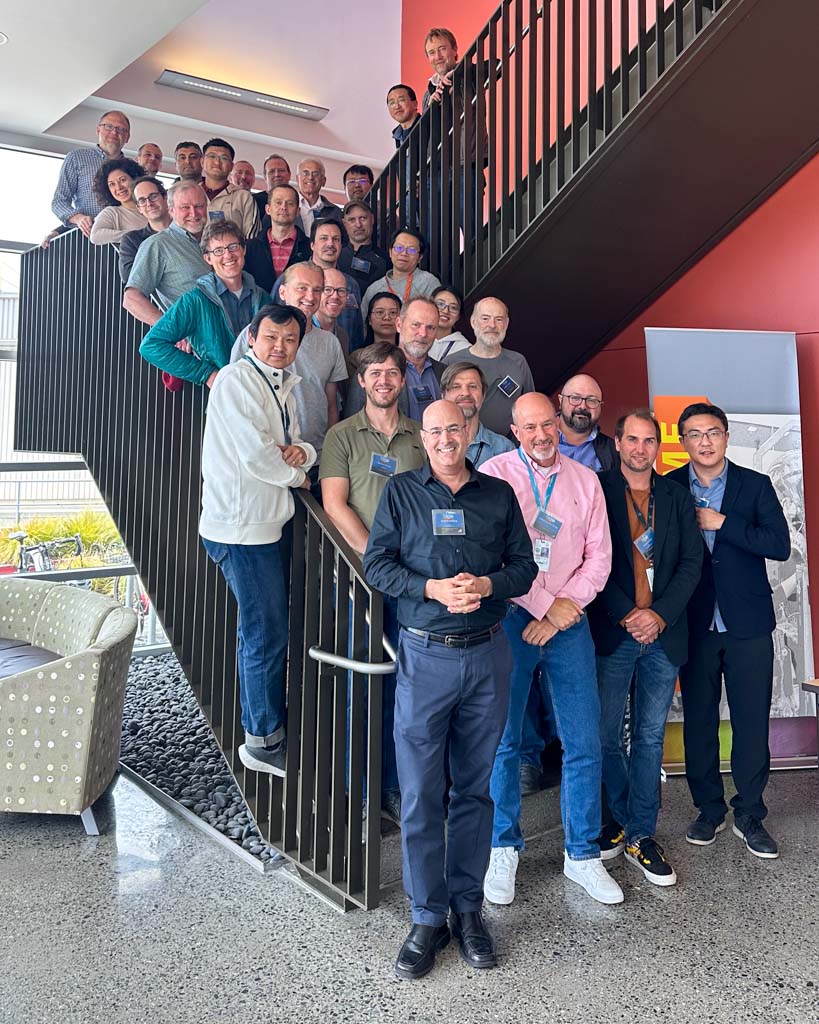
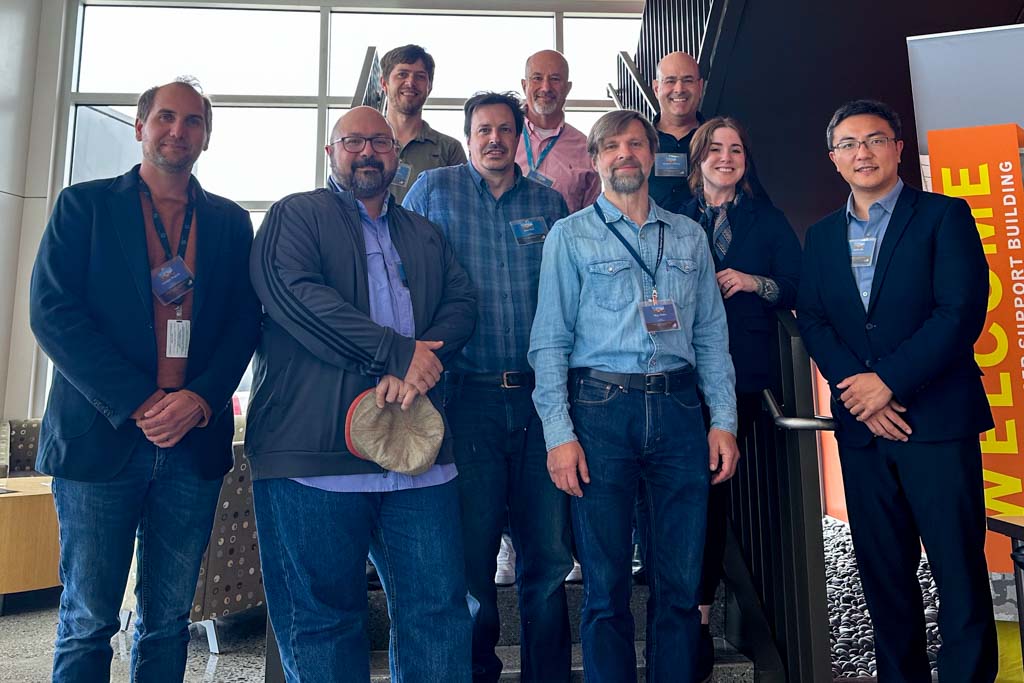
The X-Ray Beamline Optics Modeling School 2023 was a hands-on, three-day workshop held at the Advanced Light Source (May 30 to June 1, 2023). We explored the process of beamline design, specification, and modeling with modern, available tools, taught by experts in the field.
OK, if you get bored not being boring, check out these great references:
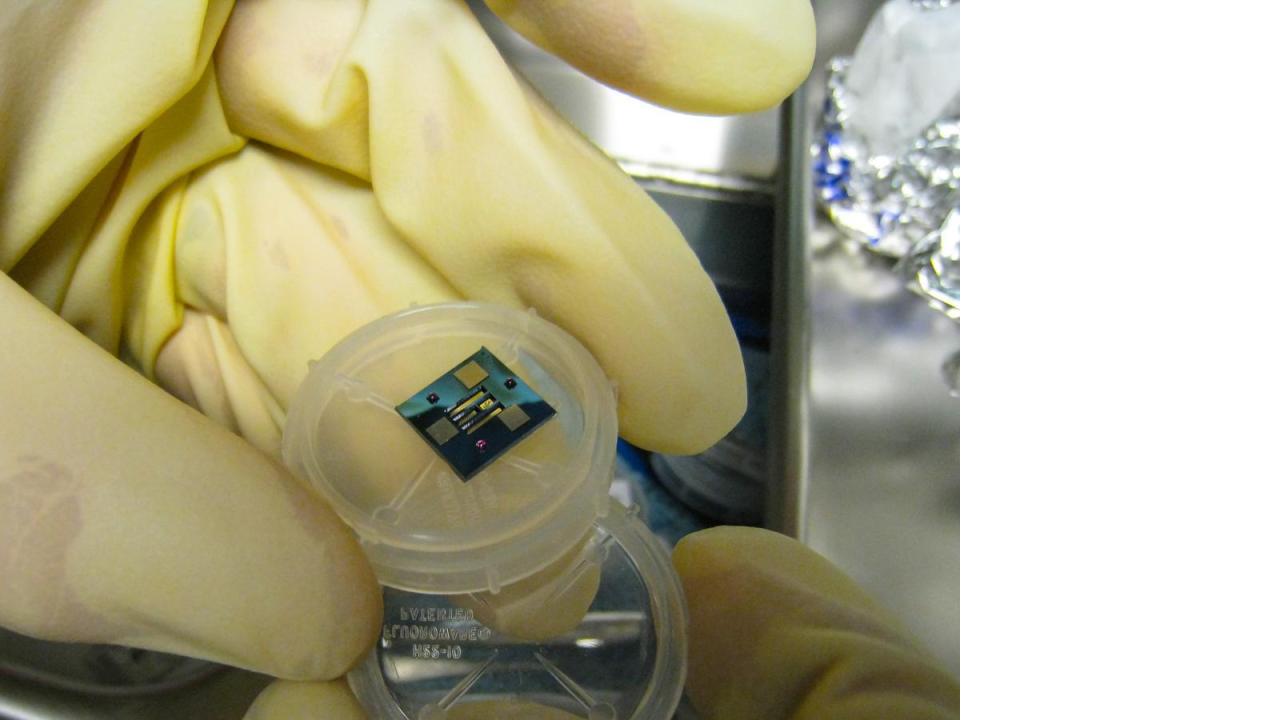
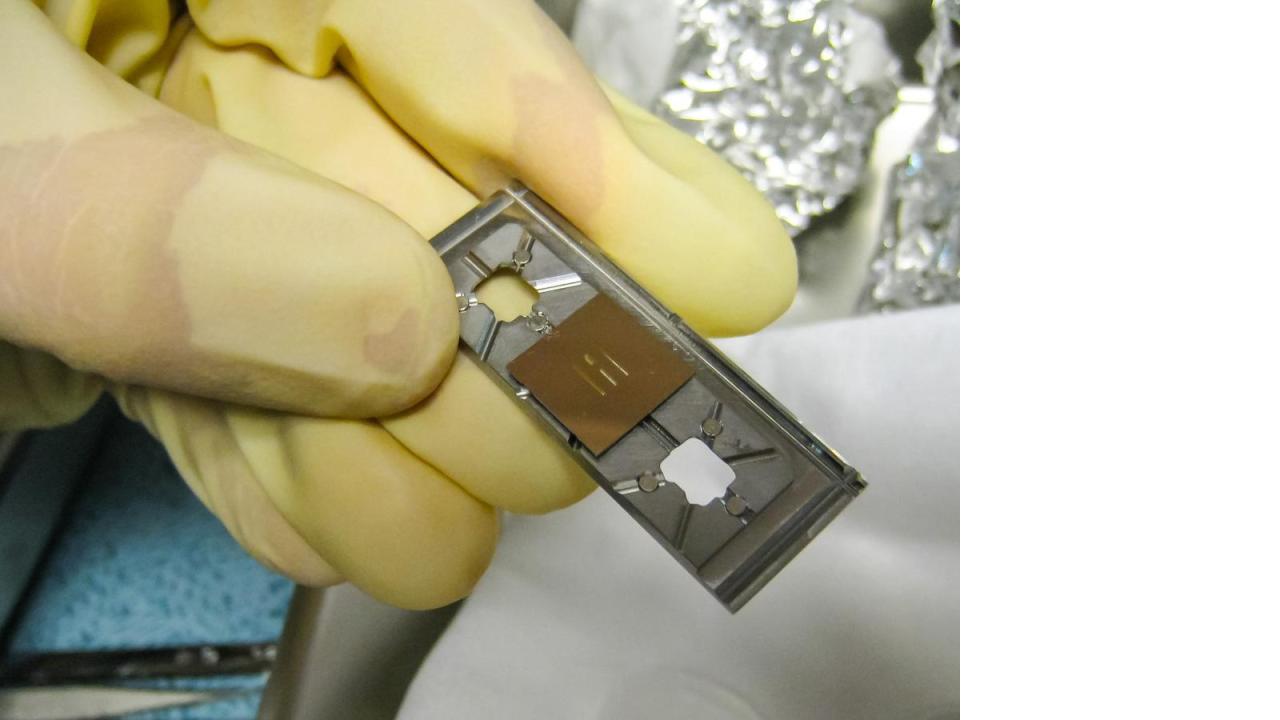
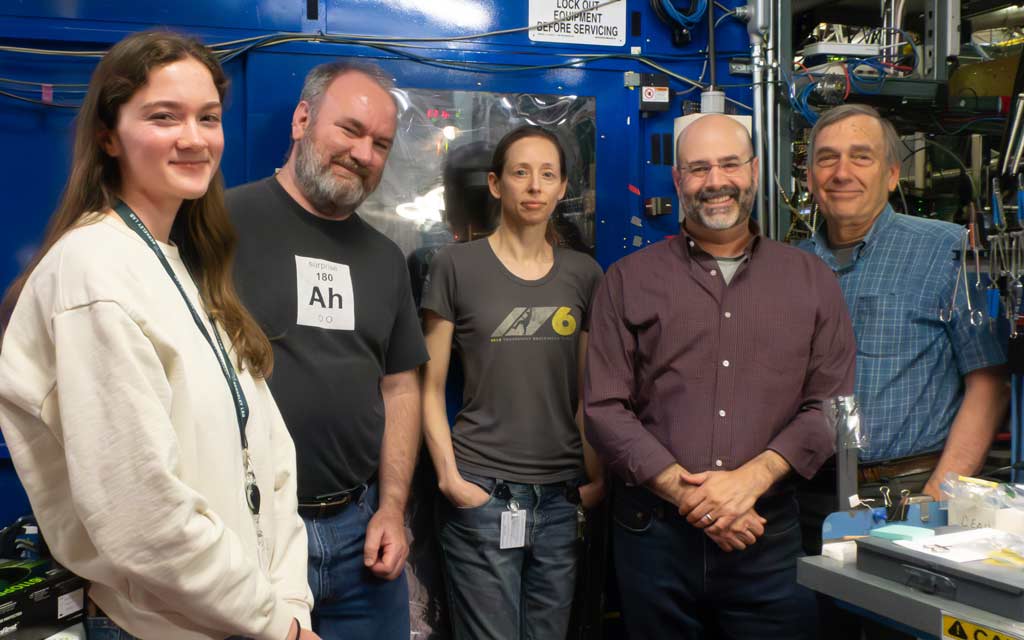
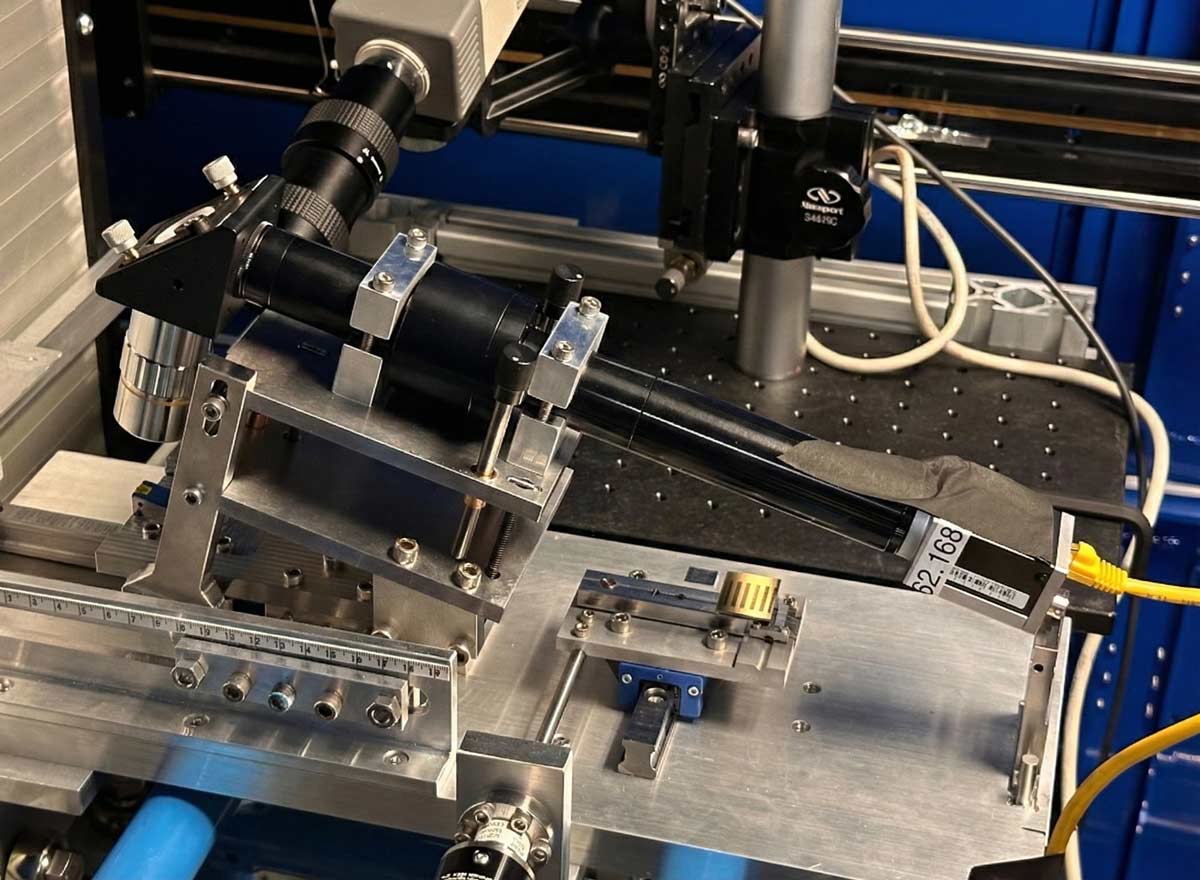
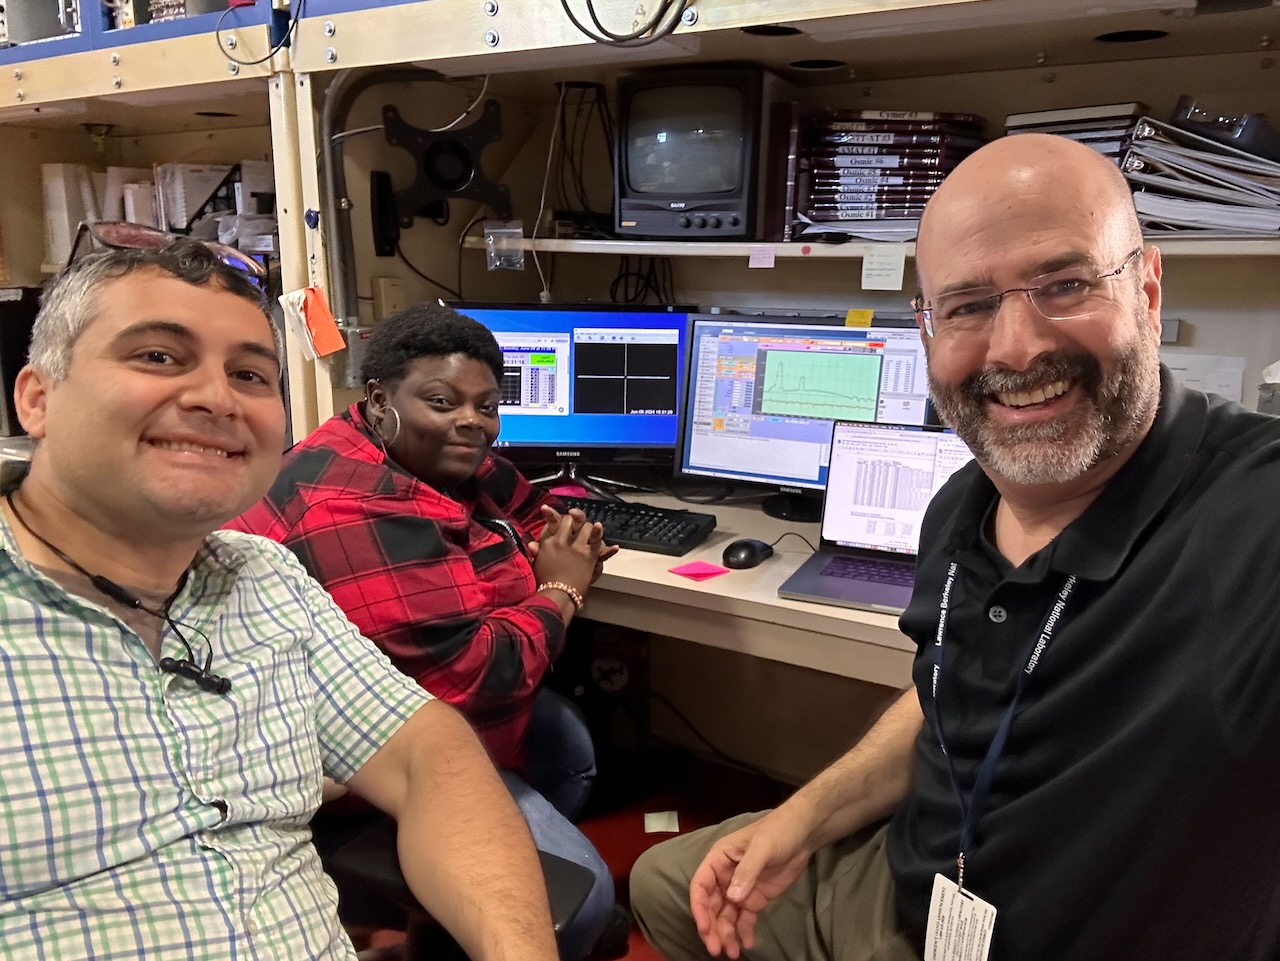
I’m very proud of some recent work testing our prototype wavefront sensor at hard x-ray wavelengths. We felt very fortunate to have this rare opportunity to test several optical elements, with kind help from the APS team led by Lahsen Assoufid. Prof. Yamauchi made this possible by sharing a new adaptive x-ray mirror made by JTEC for this collaborative work.
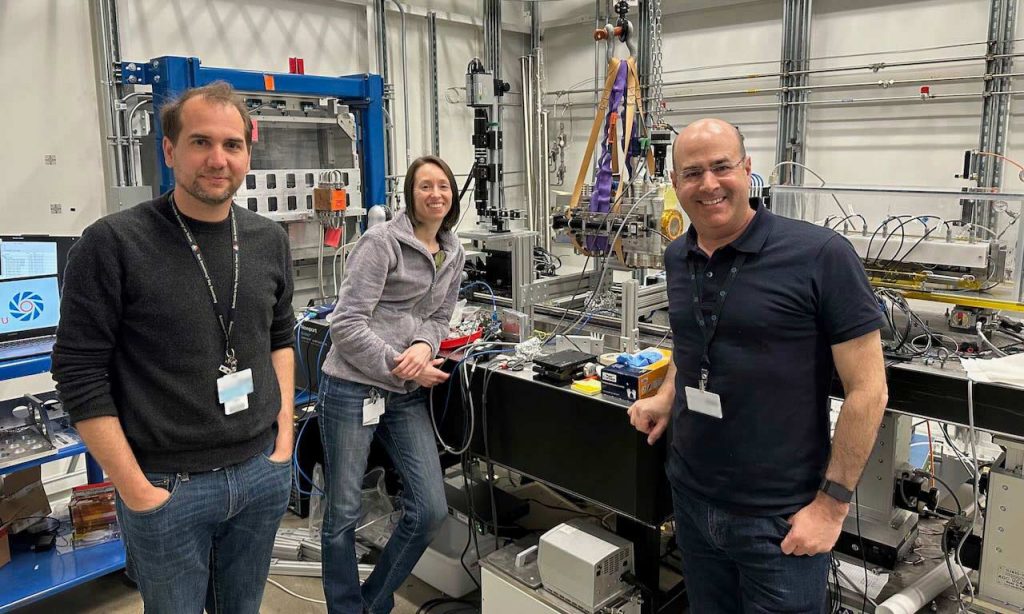
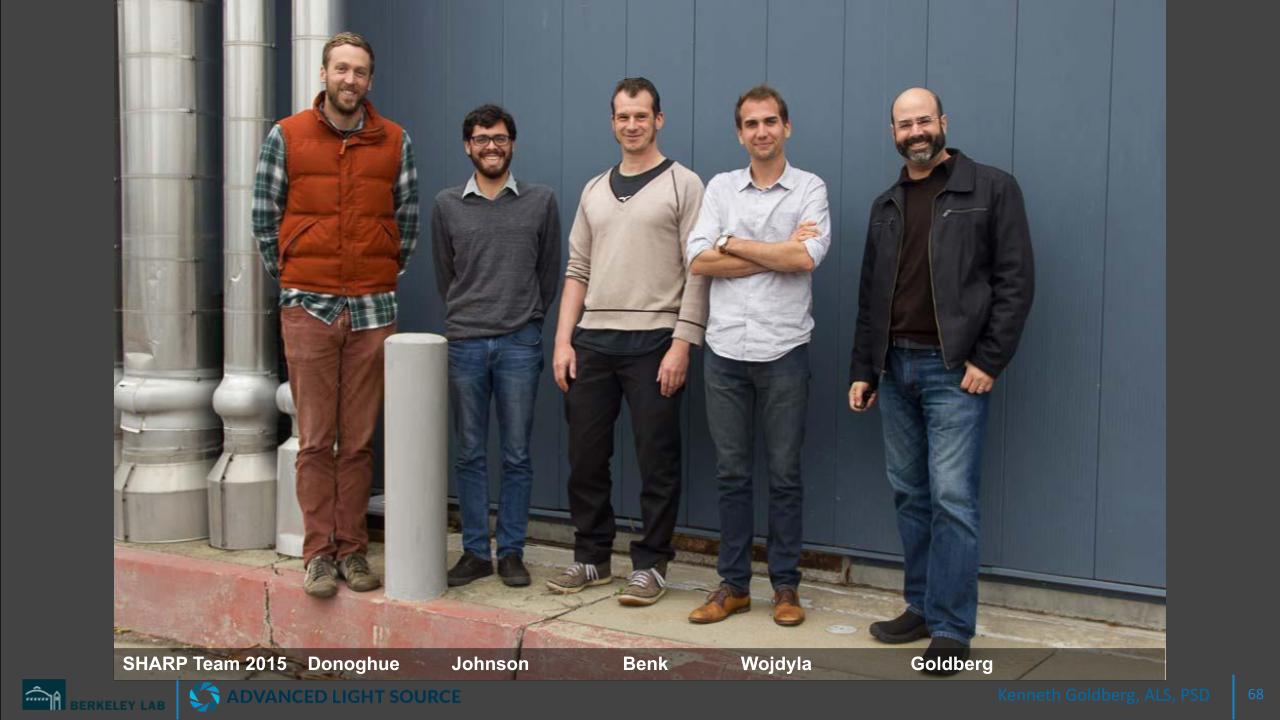
Testing the ALS wavefront sensor at the Advanced Photon Source, 29-ID. Wojdyla, Bryant, Goldberg
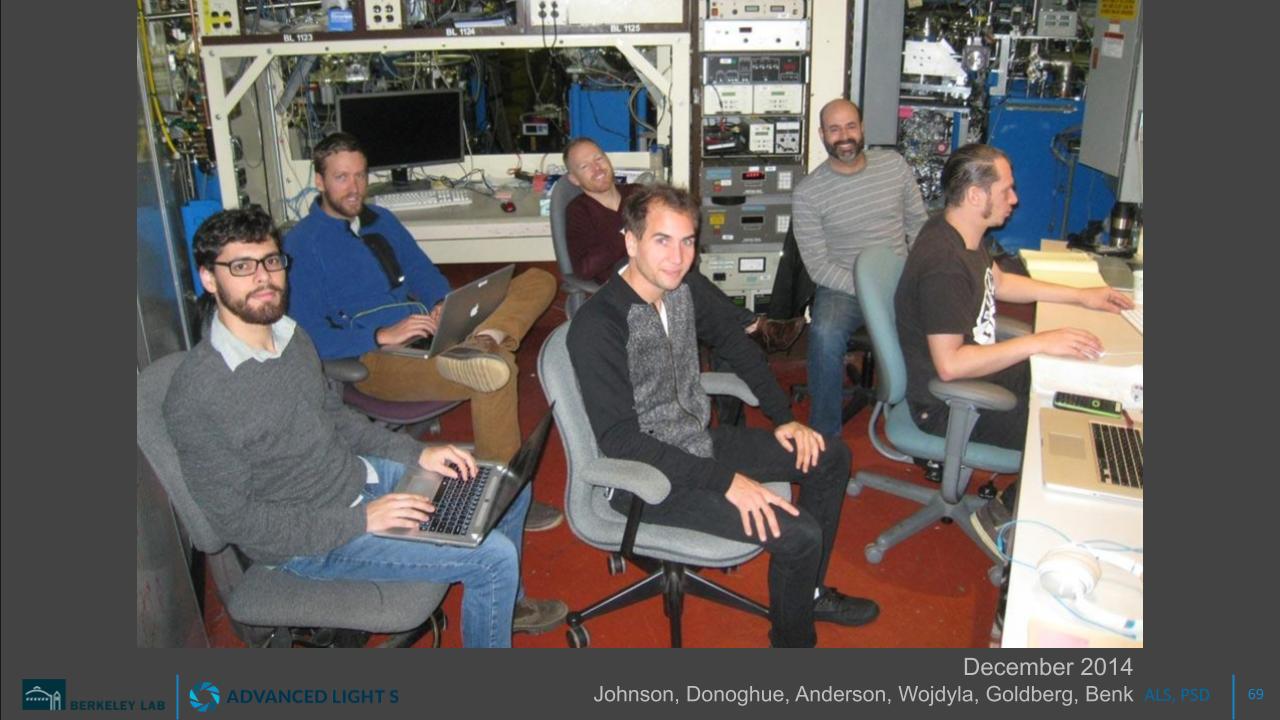
April 2023
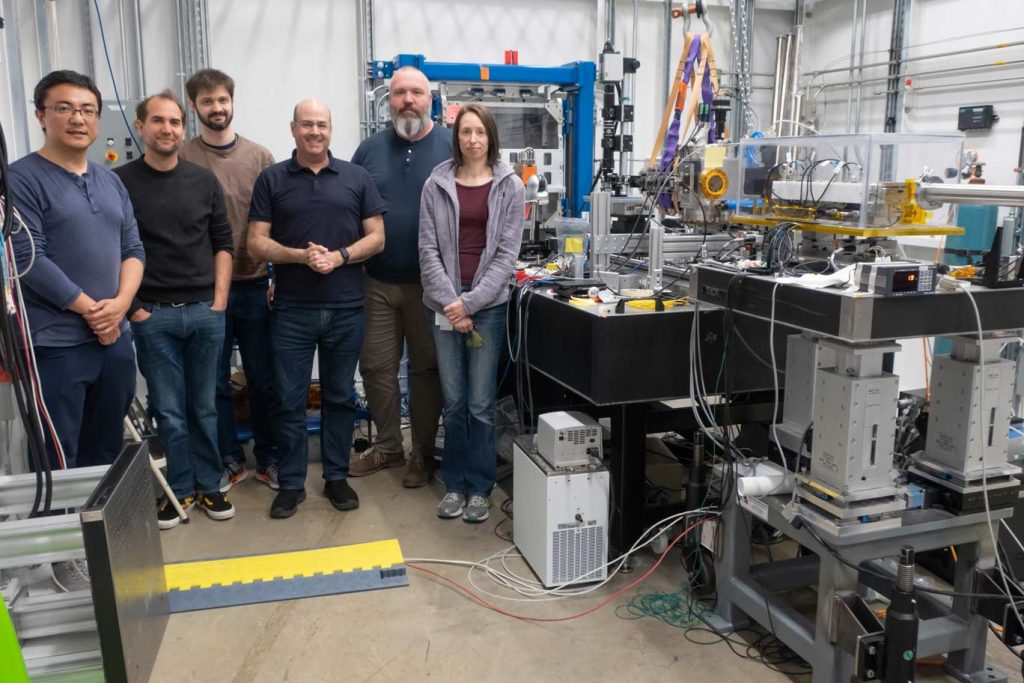
Shi, Wojdyla, Frith, Goldberg, Highland, Bryant at 29-ID, APS
April 2023
Let’s face it, these phrases have no meaning, and, in my opinion, no place in scientific literature. I’ve used them in papers—before I came to the realization that they have no value. If the agreement is good, tell us how good: use a number, an rms, a percentage, etc. One researcher’s “good agreement” is another’s “failed to converge.” Is your agreement good to within a picometer? or good simply because it’s better than the errors you saw when you collected the first data?
If you use these phrases, you’re not doing as good of a job as you could be doing. Now, there I’ve gone and used the word good, but only because I’m asking you all to do a good job. I can’t be quantitative about that.
Does your data “agree qualitatively,” because the peaks line up, more or less, and the slope is about the same? I might cut some slack if the “good agreement” is coupled somehow to the word “qualitative.”
While we’re at it, let’s remove the words “good” and “bad” from scientific literature in almost every case. Science is not a place for value judgements. Judgements, sure. Opinions, observations, and speculation, are all okay when marked as such. (“We believe…” is a perfectly legitimate way to start a sentence when you need to tell the reader that you don’t know something for sure.) Your data either agrees with something, or it does not. It agrees with the simulation to within the estimated uncertainty, or it does not. It agrees with the prediction of Dr. X [citation goes here] to within 5%, or it does not. None of us knows what you consider to be good agreement or why, until you give us a number that we can replicate or understand.
So, are we all in agreement? Good.